Example X-RAP Model
This comprehensive report provides an illustrative example of an
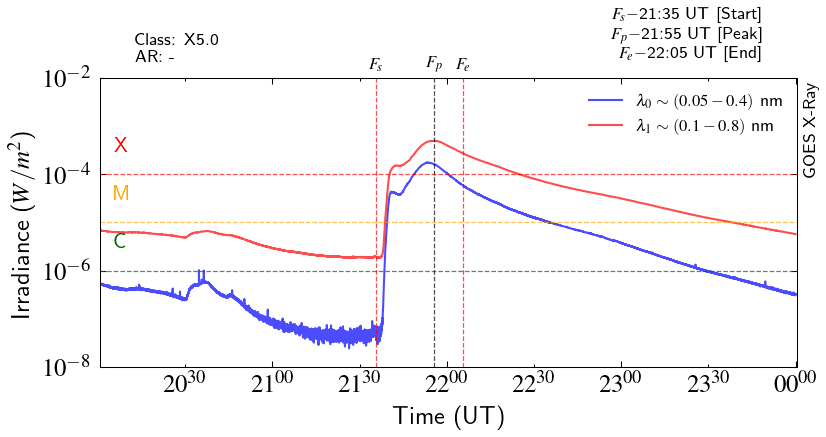
X5solar flare event that reached its peak at 21:55 UT on December 31, 2023. The top left panel offers insight into the solar irradiance condition. A detailed time series of X-ray irradiance from the GOES satellite is presented. This graphical representation allows for a dynamic visualization of the intensity of X-ray emissions throughout the duration of the solar flare. The X-ray irradiance data is essential for gauging the magnitude and potential impacts of the solar event. Flare start, peak, and end times are identified by Fs, Fp, and Fe respectively. The flare class and solar active region (flare source) is also mentioned in the top left corner. This timing and flare source information are provided by NOAA.
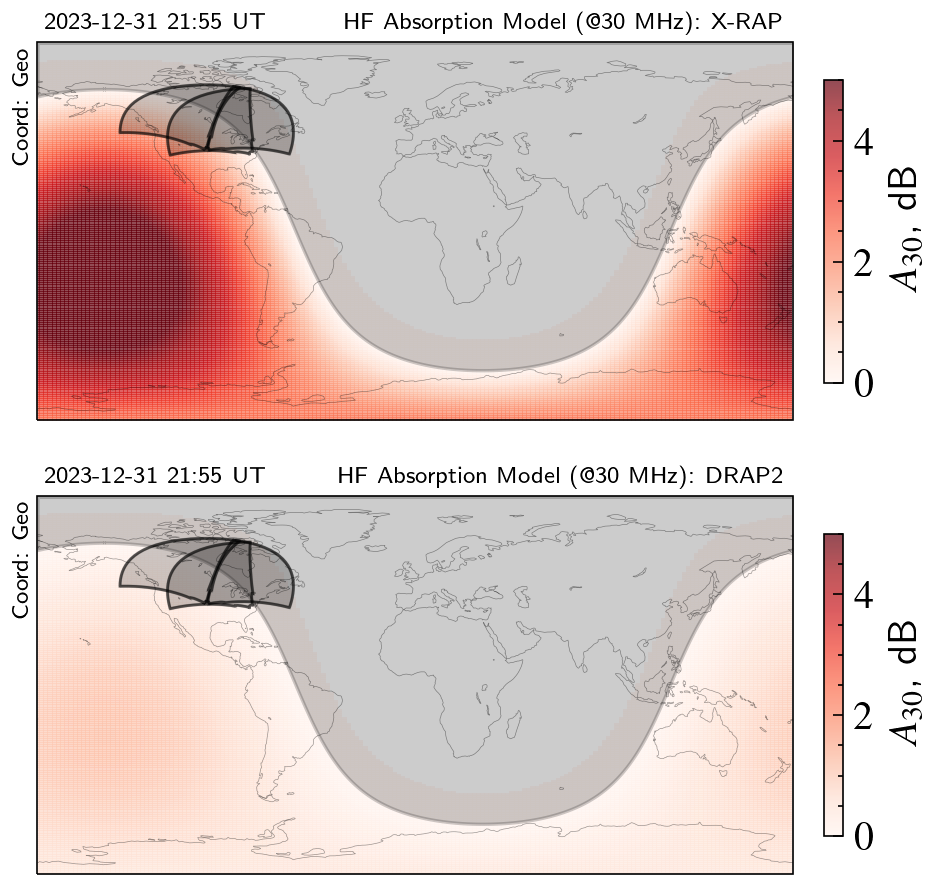
The middle and bottom panels of this visual representation showcase the output from the X-RAP and DRAP models, respectively, during the notable peak of a solar flare event. Both models were run at 30 MHz and absorption is denoted as A30. Specifically, both panels provide insights into the Near-Vertical Incidence Skywave (NVIS) High-Frequency (HF) absorption at 30 MHz. In the middle panel, output from Fiori et al. (2022)/X-RAP model is depicted. This model, which likely incorporates its unique algorithms and considerations, also portrays the expected NVIS HF absorption at 30 MHz during the flare's peak. Fiori et al.'s model adds another layer of insight into the absorption dynamics within the ionosphere, contributing to a more comprehensive understanding of the solar flare's impact. Concurrently, in the bottom panel, the DRAP model's output is depicted, offering a simulation-based perspective on how the D-region of the ionosphere absorbs HF signals during the solar flare's peak. DRAP is a renowned model designed to predict D-region ionospheric absorption, and its output in this context provides a valuable understanding of the anticipated absorption patterns during the observed solar event.
Together, these panels offer a side-by-side comparison of the predicted NVIS HF absorption during the solar flare peak, as simulated by both the DRAP model and Fiori et al.'s model. This detailed visualization provides a nuanced exploration of ionospheric absorption patterns, enriching the analysis of space weather effects on HF communication during solar flare events.