Example Event
This comprehensive report provides an illustrative example of an
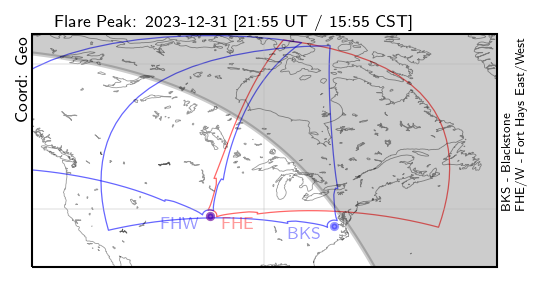
X5solar flare event that reached its peak at 21:55 UT on December 31, 2023. The top left panel offers insight into the solar zenith angle conditions over the region of interest, i.e., the North American sector, precisely during the flare peak (mentioned in UT and CST). This contextual information is crucial for understanding the spatial aspects of the flare event over North American sector along with the Fields-of-View (FoV) of the radars under consideration.
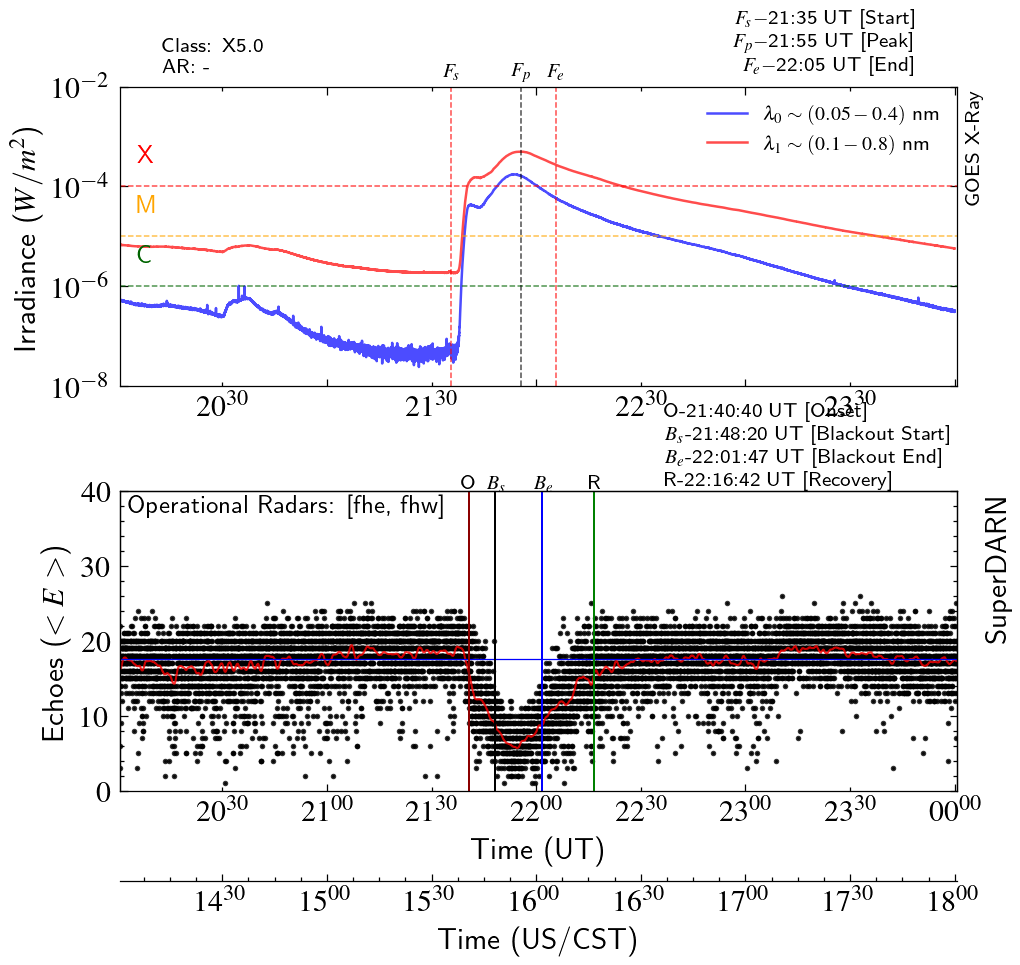
In the 2nd panel, a detailed time series of X-ray irradiance from the GOES satellite is presented. This graphical representation allows for a dynamic visualization of the intensity of X-ray emissions throughout the duration of the solar flare. The X-ray irradiance data is essential for gauging the magnitude and potential impacts of the solar event. Flare start, peak, and end times are identified by Fs, Fp, and Fe respectively. The flare class and solar active region (flare source) is also mentioned in the top left corner. This timing and flare source information are provided by NOAA.
The third panel of the report features a time series of SuperDARN ground scatters, providing a real-time depiction of ground scatter observations during the solar flare. SuperDARN ground scatter data (
E) is invaluable for understanding the ionospheric response and any disturbances induced by the solar flare in the Earth's upper atmosphere. Onset, blackout start, end and recovery times are identified by O, Bs, Be, and R respectively. In all the cases times are inUT. For reference figure provideUS/Centrallocal time.
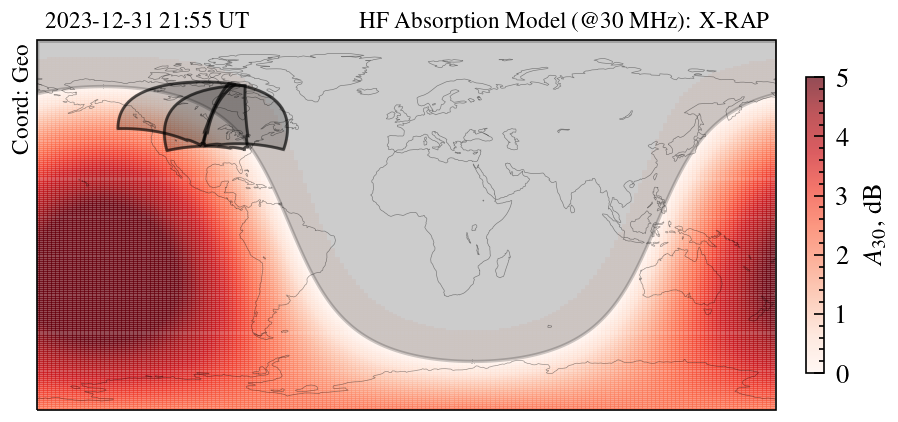
The bottom panel of this visual representation showcase the output from the X-RAP model, during the notable peak of a solar flare event. X-RAP model was run at 30 MHz and absorption is denoted as A30. Specifically, the panel provide insights into the Near-Vertical Incidence Skywave (NVIS) High-Frequency (HF) absorption at 30 MHz.
Together, these panels offer a holistic view of the
X5solar flare event, combining solar zenith angle conditions, X-ray irradiance data, and SuperDARN ground scatter observations. This report serves as an exemplary showcase, highlighting the interconnectedness of solar events, their impact on the ionosphere, and the observational tools used to monitor and analyze such phenomena.