A few weeks ago, I came across a remarkable open dataset — the Civilizations Explorer — that compiles structured records of ancient battles, empires, trade routes, thinkers, and wonders from over 5,000 years of human history. All data is sourced from Wikipedia (CC BY-SA 4.0), Wikidata (CC0), and the Pleiades Project (CC BY 3.0). As a scientist who spends most of my time thinking about electromagnetic waves and geomagnetic storms, I found myself unexpectedly fascinated by the question: can the same data-driven instincts I bring to space weather help reveal patterns in human history?
This post curates those datasets, runs a geospatial and temporal analysis, and produces visualizations of how battles, empires, and trade routes interacted across centuries. The central question: did battles cluster near trade routes, and did military outcomes reshape the geography of commerce?
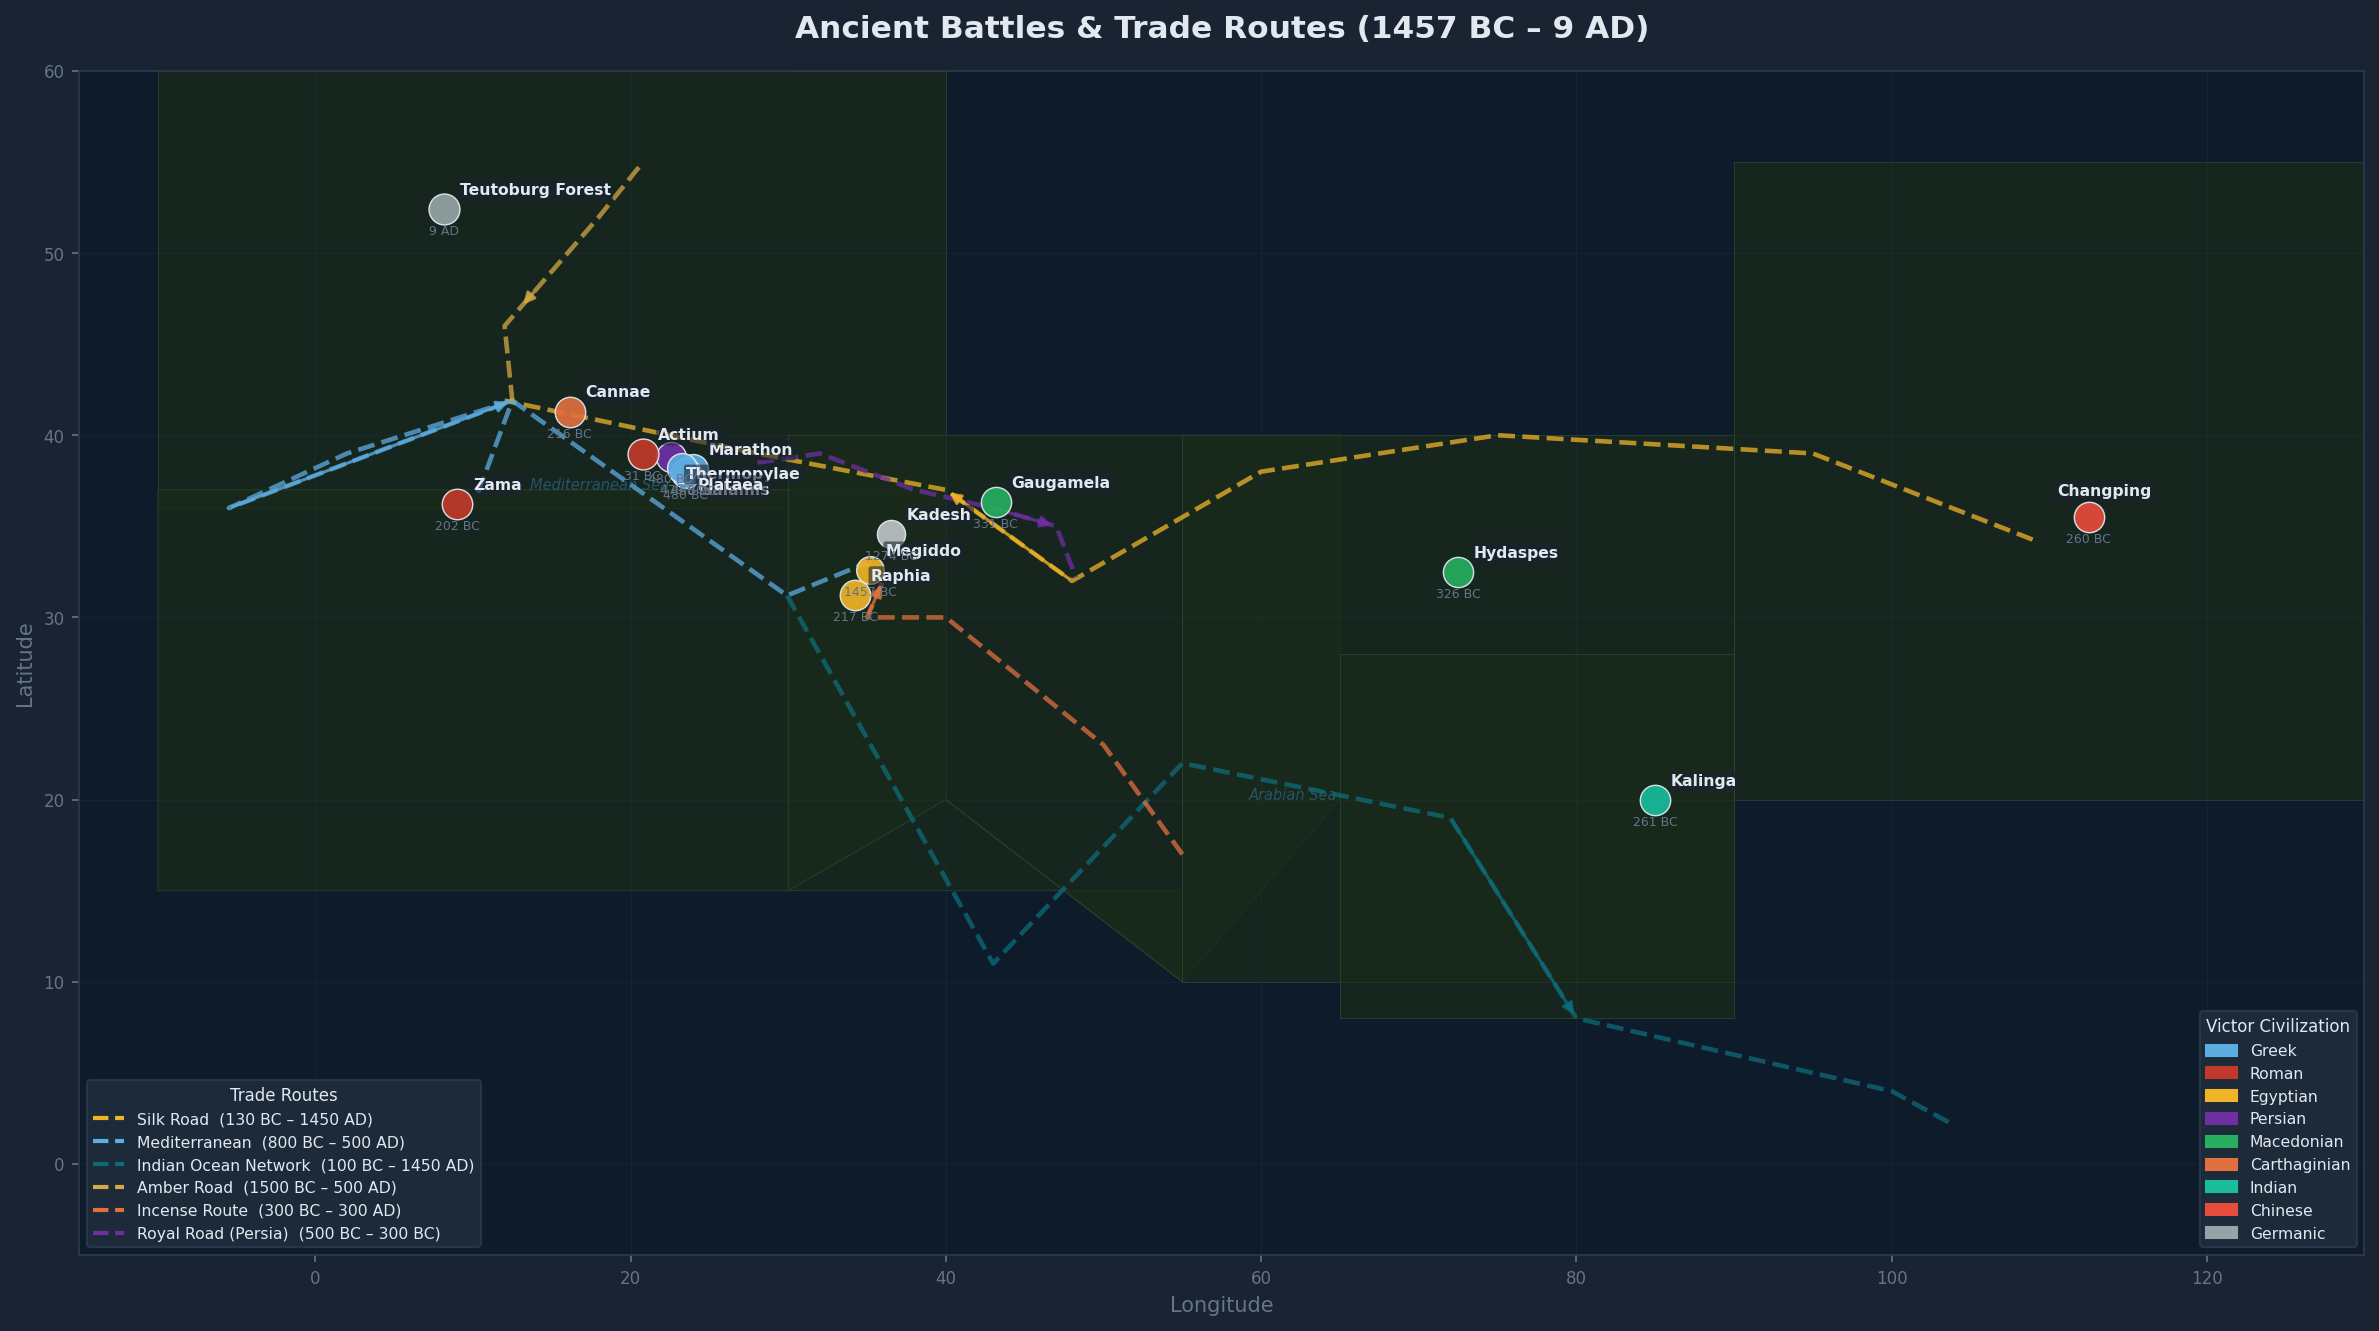
Figure 1 — The Geography of Ancient War and Commerce
Figure 1 maps all 15 battles on a real Natural Earth coastline basemap, overlaid with the six major ancient trade routes. Marker color encodes the victor civilization; marker size reflects geopolitical significance — larger dots mark battles whose outcomes redirected the flow of history for centuries. Route line width scales with economic importance: the Silk Road and Indian Ocean Network are drawn thickest because they carried the greatest trade volume and lasted longest.
Why did battles happen near trade routes? Three structural reasons
The co-location of battles and trade routes in Figure 1 is striking — but it is not coincidental. Three deep structural forces explain why ancient warfare and commerce shared the same geography.
1. Terrain determines both paths. Trade routes did not follow straight lines; they followed the only viable paths through difficult terrain — mountain passes, river crossings, coastal straits, and desert oases. The same geography that funneled merchants also funneled armies. Thermopylae (480 BC) was fought at a 15-meter-wide coastal pass between cliffs and sea because it was the only overland route from northern Greece to the south — the same pass used by every merchant caravan moving grain from Thessaly to Attica. Gaugamela (331 BC) was fought in the flat plain between the Tigris and the Zagros foothills because that corridor was simultaneously the Persian Royal Road's trunk route and the only terrain where Alexander's cavalry could be deployed at full effectiveness. Battles and trade routes share geography because mountains, rivers, and coasts impose the same constraints on soldiers and merchants alike.
2. Trade generates the tax revenue that funds armies. In the ancient world, the primary source of state revenue was not land taxation but transit taxation — tolls on goods moving through controlled territory. The Nabataean kingdom at Petra built its entire civilization on controlling the Incense Route; Carthage's power derived from monopolising western Mediterranean shipping lanes; Persia's Royal Road was as much a tax-collection infrastructure as a military one. Whoever controlled a trade chokepoint extracted rent from every merchant passing through. This made chokepoints worth fighting over: a single pass or port could generate enough revenue to field an army. The Persian Wars were explicitly a contest over who would tax Eastern Mediterranean trade — Athens or Persia. The Punic Wars were a 120-year contest over who would tax western Mediterranean shipping — Rome or Carthage. The battle was the bid to capture the toll booth.
3. Trade routes are army supply lines. Ancient armies could not carry more than a few weeks of food. The logistical constraint was absolute: an army marched where it could eat. Trade routes — which by definition ran between productive agricultural zones and connected to networks of markets and storehouses — were the only viable paths for large-scale military campaigns. Alexander the Great did not conquer Persia by choosing a random route through Asia; he followed the Persian Royal Road precisely because it had the grain depots, water sources, and population centers needed to feed 40,000 soldiers._ The Silk Road and the roads Alexander used were the same roads. When Hannibal crossed the Alps (218 BC) to reach the Po Valley, he was following existing trade routes through the Alpine passes — the only paths where his elephants and supply wagons could travel. Military campaigns were not alternative uses of trade routes; they were dependent on them for survival.
The Eastern Mediterranean Chokepoint
Of the 15 battles, 9 occurred within a corridor where three major routes converge: the western terminus of the Silk Road, the eastern terminus of the Mediterranean Sea Routes, and the northern terminus of the Incense Route. The Persian Wars (490–479 BC), Alexander's campaigns (331–326 BC), the Punic Wars era battles (217–202 BC), and Actium (31 BC) were all, at their economic core, contests for control of this convergence zone — the node where goods from China, India, Arabia, and Africa arrived in the Mediterranean world.
Two battles in the dataset fall far outside this zone — Changping (−260 BC, northwest China) and Kalinga (−261 BC, eastern India) — and they illustrate the same principle from a different angle. Neither was fought on a trade route, but both had profound trade consequences. The Qin victory at Changping, which killed an estimated 400,000 Zhao soldiers, broke the last obstacle to Qin unification of China (221 BC). That unification created the political stability and administrative infrastructure that made the eastern Silk Road terminus viable — without it, there was no unified Chinese state to trade with. Ashoka's conversion after Kalinga transformed Maurya India from a conquest state into a Buddhist polity that actively encouraged merchant travel, making India a hospitable transit zone for Silk Road commerce. These battles did not happen on trade routes; they happened to create the conditions that made trade routes possible.
Figure 2 — Timeline of Decisive Battles
A timeline view reveals the clustering of battles — periods of unusually compressed military decision-making — and their relationship to the trade route activity bands shown at the bottom of the chart.
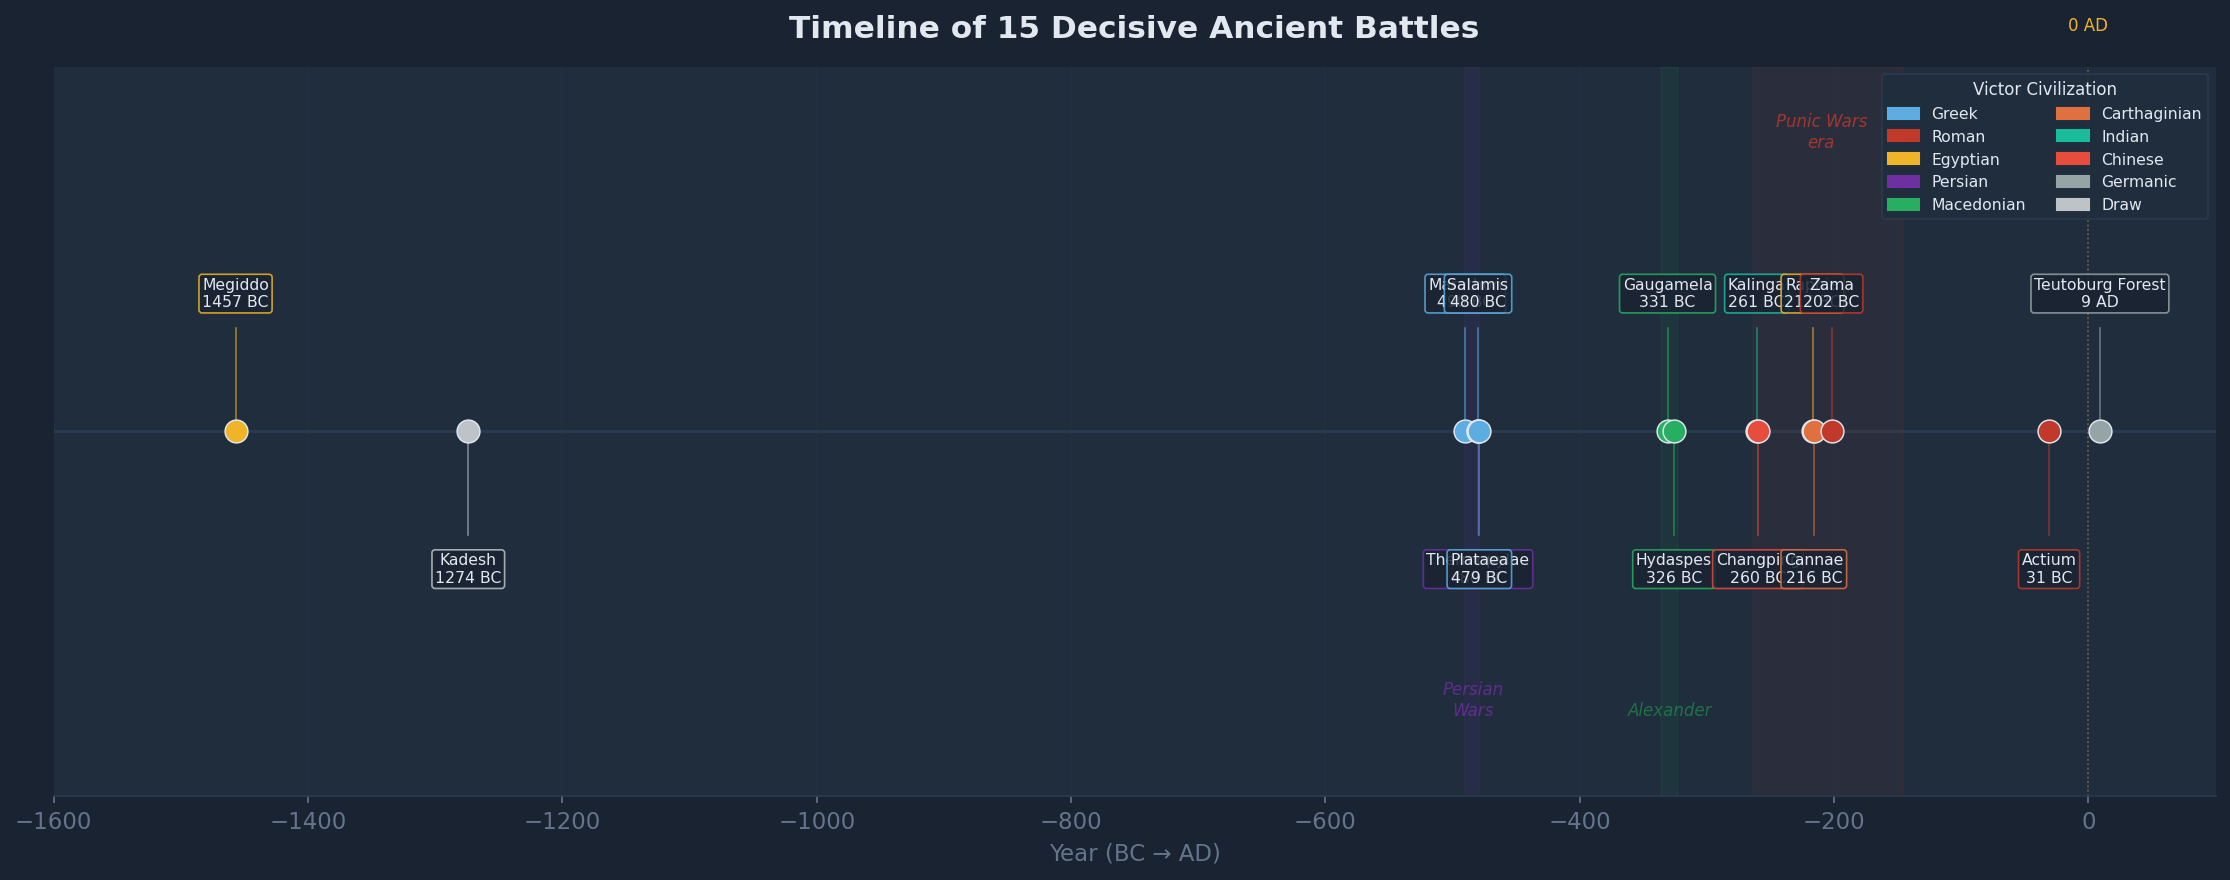
Three clusters dominate the timeline, each coinciding with the peak activity period of a major trade route:
- The Persian Wars (490–479 BC) — Marathon, Thermopylae, Salamis, Plataea in eleven years. Fought entirely during the active phase of both the Mediterranean Sea Routes and the early Silk Road. The immediate stakes were political survival, but the underlying prize was control of the Aegean — the gateway through which eastern luxury goods entered the Greek world. Athens' naval power after Salamis was funded by silver from the Laurion mines, which were worked by slaves purchased from eastern trade networks.
- Alexander's Decade (336–323 BC) — Gaugamela (331 BC) to the Hydaspes (326 BC). Alexander's campaigns physically merged the Persian Royal Road, the Silk Road, and the Indian Ocean Network into a single, temporarily unified trade corridor. The economic consequence was immediate: within a generation of Alexander's death, Greek-Bactrian kingdoms were minting bilingual coins (Greek and Brahmi) for use along trade routes that Alexander had opened, and Ptolemaic Egypt was sending merchant fleets directly to India via the Red Sea for the first time.
- The Punic Wars Era (264–146 BC) — Cannae, Raphia, and Zama cluster within a single turbulent century. The explicit prize was Mediterranean maritime supremacy. Rome's victory at Zama (202 BC) and the eventual destruction of Carthage (146 BC) gave Rome uncontested control of western Mediterranean shipping. The economic consequence: Roman merchants extended the Mediterranean Sea Routes eastward, eventually connecting to the Indian Ocean Network via Egypt, creating the trade network that carried Indian pepper to Roman kitchens and Roman glass to Indian courts.
Figure 3 — Empire Duration: Timespans and Longevity
Understanding how long empires lasted helps explain which battles had durable trade consequences. A 13-year empire (Macedonian) could open trade corridors but not institutionalize them; a 985-year empire (Roman) could build the administrative and legal infrastructure that made commerce self-sustaining.
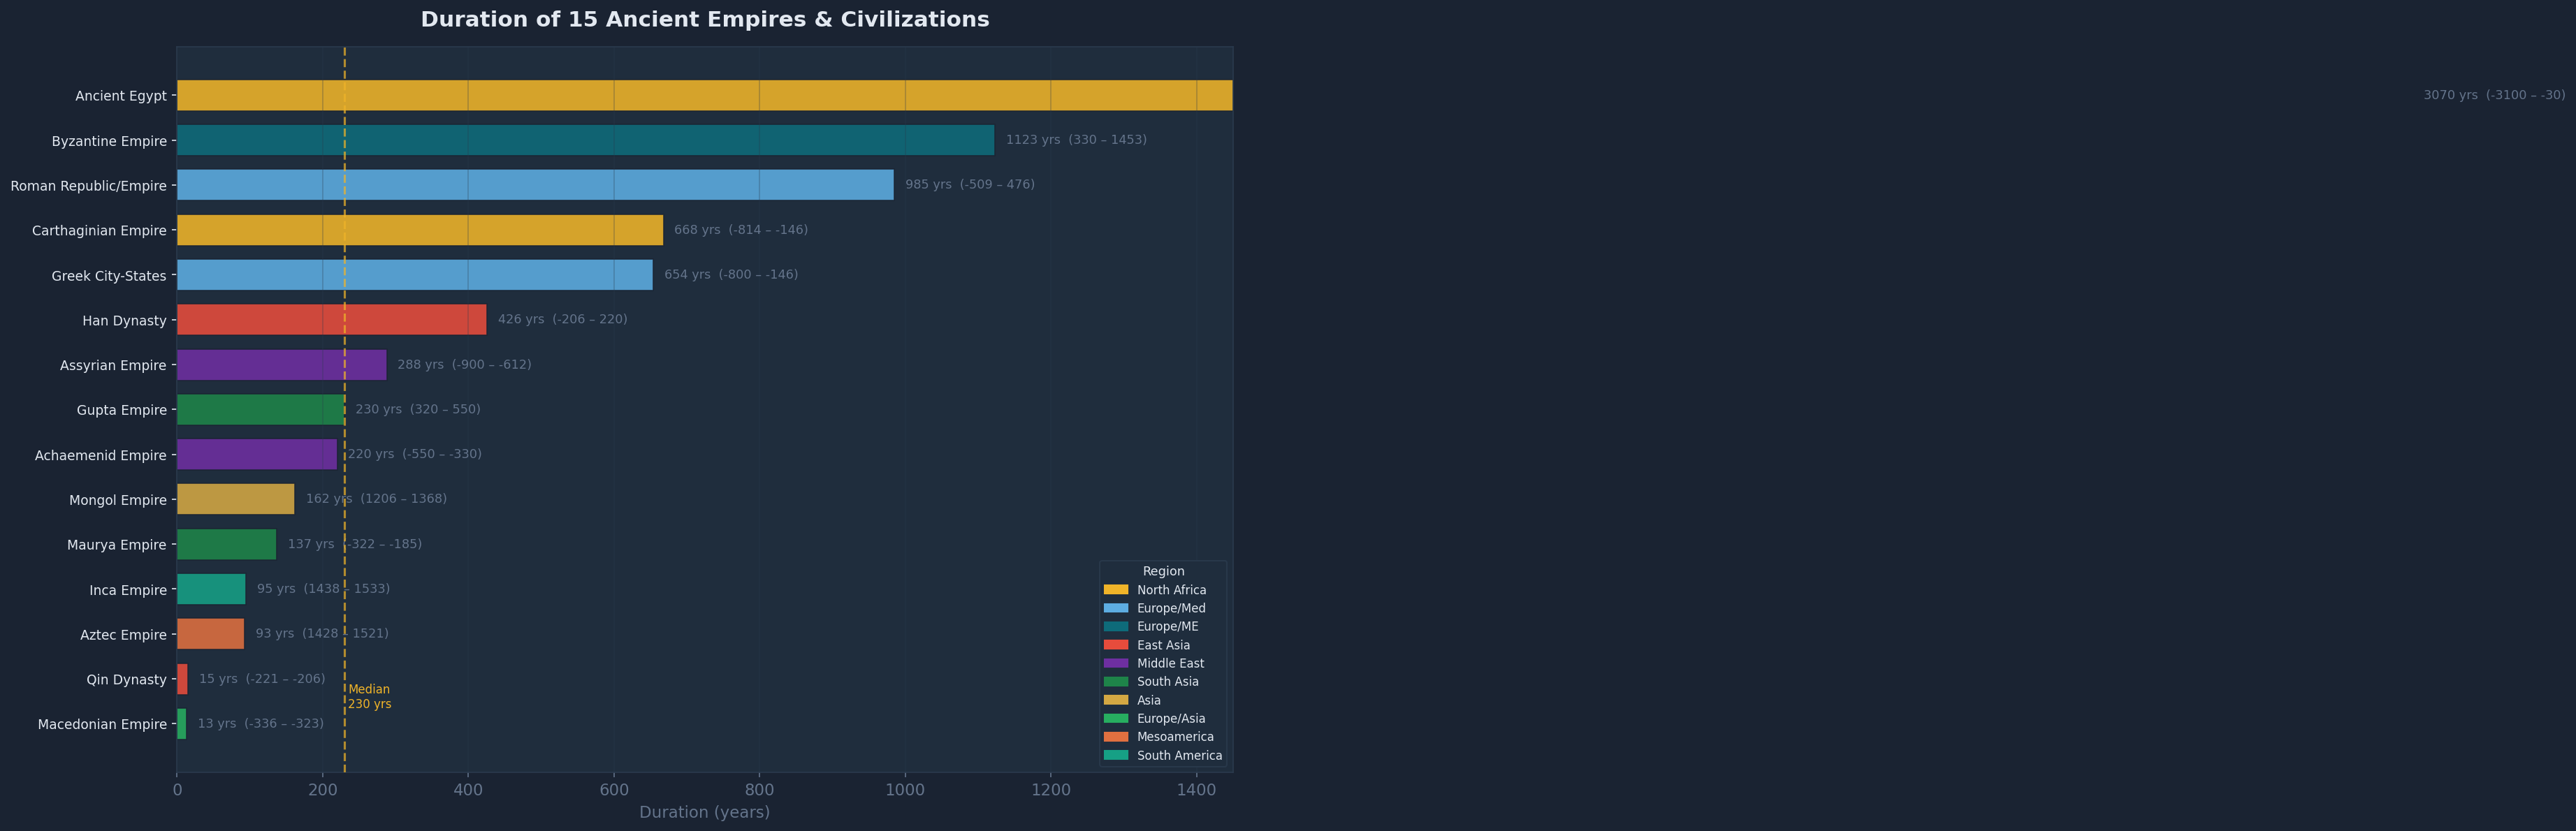
The median empire duration of 230 years is striking when compared to the lifespan of trade routes. The Silk Road lasted 1,580 years — roughly 7× the median empire. The Mediterranean Sea Routes lasted 1,300 years — nearly 6× the median. This disparity is not random: it reflects the difference between political authority (brittle, personality-dependent) and economic necessity (durable, incentive-driven). Empires come and go; merchants keep moving goods as long as there is profit in it.
- Byzantine Empire (1,123 years) — outlasted every other empire in the dataset by surviving as a trade intermediary. Constantinople sat at the intersection of the Silk Road's western terminus and the Mediterranean Sea Routes. Even as Byzantine military power shrank, the city's commercial function kept it viable for a millennium after Rome fell.
- Ancient Egypt (3,070 years) — longevity driven by the Nile's unique hydrology (reliable annual floods, zero drought risk) plus geographic isolation. Critically, Egypt controlled the nexus between Mediterranean and Red Sea trade — whoever held Egypt held the pivot between the two largest ancient trade networks.
- Macedonian Empire (13 years) and Qin Dynasty (15 years) — conquered vast territories but built no durable administrative institutions. Both collapsed immediately upon their founder's death. Yet both had enormous trade consequences: Alexander's empire created the Hellenistic world that unified eastern Mediterranean commerce for 200 years after his death; Qin's unification created the unified Chinese state whose Han successor opened the eastern Silk Road.
"The lesson of empire longevity is not about military strength — it is about administrative depth. The empires that outlasted everyone else were the ones that standardized currency, codified law, and gave merchants a predictable system to operate within. Trade does not require a strong empire; it requires a predictable one."
Figure 4 — Strategic Threat Matrix: Battles vs. Trade Routes
To quantify the battle–trade route relationship, I computed the geographic proximity of each battle location to each trade route corridor, expressed as a normalized threat level (1 = battle on the route, 0 = distant). Battles are sorted by total route exposure — the most strategically contested battles appear at the top.
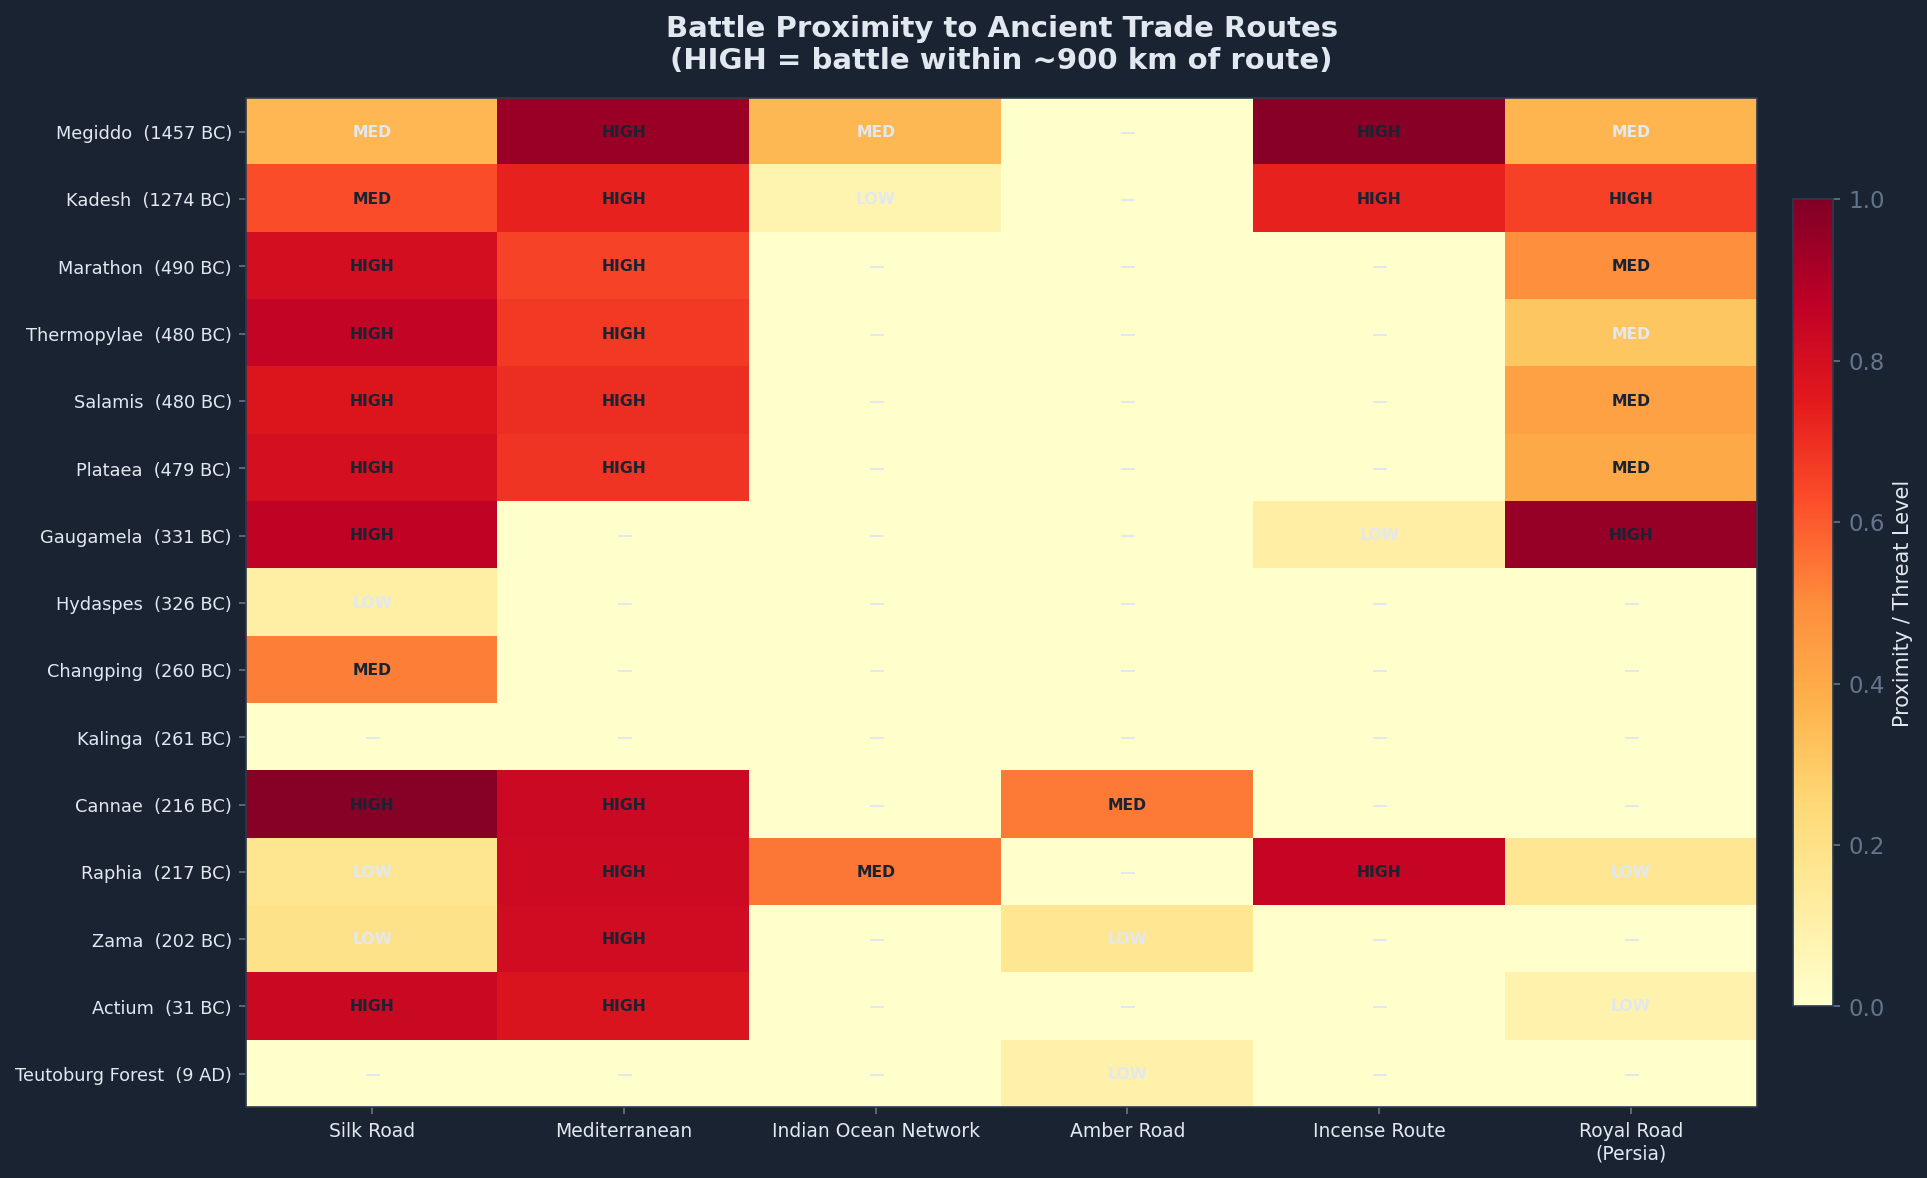
Several patterns emerge from this matrix that directly support the structural argument:
Gaugamela (331 BC) scores HIGH on three routes simultaneously — the Silk Road, Mediterranean Sea Routes, and the Royal Road. This is not coincidence: Alexander fought this battle specifically to seize the Persian administrative capital at Persepolis, which sat at the junction of all three. By winning Gaugamela, Alexander simultaneously captured the Royal Road's operational network (complete with relay stations every 25 km, capable of moving royal couriers 2,700 km in seven days), the western Silk Road corridor, and the Persian Gulf ports that connected overland trade to Indian Ocean shipping. A single battle gave him control of three trade systems.
Actium (31 BC) scores HIGH on Mediterranean but MEDIUM on Silk Road — exactly what we would expect. The battle was fought in the Ionian Sea off the Greek coast, directly on the Mediterranean Sea Routes. But Octavian's victory had a second-order Silk Road consequence: by consolidating Egypt under Roman rule, he secured the Red Sea ports (Berenice, Myos Hormos) that were Rome's gateway to Indian Ocean trade. Within decades of Actium, Roman merchants were sailing directly to India on the monsoon winds, bypassing Parthian middlemen on the overland Silk Road. Actium reshaped the Indian Ocean Network from a distance.
The Royal Road shows concentrated exposure to Gaugamela and Kadesh — both fought directly on or adjacent to the road's corridor. The Royal Road was not merely a trade artery; it was a military command-and-control network. The Persian empire's ability to project power across 2,700 km depended entirely on this road. When Alexander took it, he did not just gain a route — he inherited a logistics system that allowed him to continue his campaign eastward rather than halting at the Persian frontier.
The Amber Road shows almost no battle exposure — the single outlier in the dataset. The northern European trade in amber, furs, and tin generated wealth but not enough to make the Baltic coast worth fighting over at the strategic level. The Battle of Teutoburg Forest (9 AD) is the only exception, and even that was not fought over the Amber Road itself but over Roman control of the Rhine — a boundary that happened to intersect the road's southern terminus.
Trade Route Resilience: The Paradox
Despite scoring HIGH on proximity to nearly every major battle in the dataset, the Mediterranean Sea Routes, Silk Road, and Indian Ocean Network all continued operating for centuries after each disruption. The Silk Road survived Alexander's conquest, Parthian fragmentation, Roman–Parthian wars, and the eventual collapse of Rome — operating continuously for 1,580 years. This suggests that trade routes are not disrupted by nearby battles; they are redirected. Merchants found alternative paths, different intermediaries, or simply waited for the fighting to stop before resuming. The economic incentive to connect supply and demand proved more durable than any political or military disruption.
Figure 5 — The Axial Age: Political Stress Drives Intellectual Innovation
The bottom panel of Figure 5 was the most unexpected result of this analysis. When I overlaid battle intensity (computed as a smoothed count of battles per decade from the dataset) against the thinker timeline, a clear correlation emerged: the period of highest battle intensity in the dataset — roughly 600–400 BC — coincides precisely with the Axial Age, the period philosopher Karl Jaspers (1949) identified as producing simultaneous intellectual revolutions across five disconnected civilizations.

In the Axial Age band, five independent civilizations produced their defining thinkers simultaneously:
- Greece: Pythagoras (−570), Socrates (−470), Hippocrates (−460), Democritus (−460) — all within a single century
- China: Laozi (−601), Confucius (−551), Sun Tzu (−544) — during the Spring and Autumn period of intense interstate competition
- India: Chanakya (−375) — writing the Arthashastra precisely as the Maurya Empire was forming from the chaos of Alexander's Indian campaign
- Persia: Zoroaster — whose ethical monotheism was a direct response to the collapse of Bronze Age polytheistic frameworks
The causal mechanism is not mystical. All five regions were simultaneously experiencing three converging pressures during 600–400 BC: (a) iron-age metallurgy disrupting existing agricultural and military hierarchies; (b) state formation stress as city-states and kingdoms competed for the same trade corridors we saw in Figures 1 and 4; and (c) the failure of Bronze Age religious frameworks to explain the new world of interstate war, economic inequality, and political instability. When existing answers stop working, societies generate new questions — and the thinkers who ask them. The Axial Age was not a coincidence. It was the intellectual response to the same forces that produced the battle clusters we see in Figure 2.
Data & Reproducibility
All figures were generated using Python (matplotlib) from the structured datasets in the Civilizations Explorer. The underlying data is fully open-licensed:
| Source | License | Data Used |
|---|---|---|
| Wikipedia | CC BY-SA 4.0 | Battle names, years, locations, outcomes; empire dates; thinker biographies; wonder status |
| Wikidata | CC0 (Public Domain) | Structured entity dates and coordinates via SPARQL |
| Pleiades Project | CC BY 3.0 | Latitude/longitude for ancient place names |
Only structured facts (names, dates, coordinates, classifications) were extracted. No article prose was reproduced. Every coordinate used in the geospatial figures is an approximation based on modern equivalents of ancient place names, cross-referenced with Pleiades Project records.